Evaluation
|
Construct
|
Calculate
|
Document
|
Now that you are at the end of the unit of work it is time to reflect on your task as a whole. You have spent the time developing housing, water, electricity and food, and this is the time to take a look back at all of that and thinking about whether this is a place you feel your family would be comfortable living in. This involves looking whether you feel that the house you designed, the appliances you put in it and the restrictions you placed on on water, and the amount of grown food will contribute to a family who would be really happy living in that house and making use of their yard.
|
In this final section of the task you are going to get feedback on your develop and evaluate that feedback to look for areas to improve.
As you have gone through you have given yourself a star rating for each part of the development, this goes in the developer score. The teacher will act as the client for this evaluation, they will look at it from the perspective of the family and determine what they feel the star rating would be for them and the property that was developed. Finally you will show your work on this task to 3 other people who will provided their star rating on each aspect of your development. The average of these scores will become the peer score. |
|
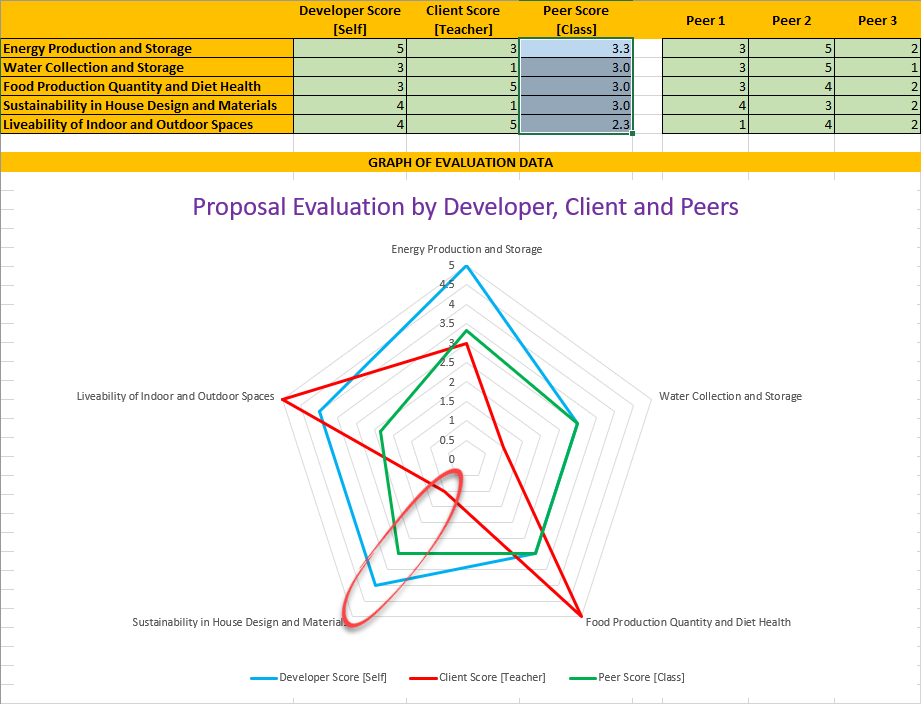
.In the analysis of the data you will be looking for trends in the data in the graph. You read the graph by looking at what those lines are doing at the corners of the pentagon, this is shown by the red circle in the image above. Therefore in the one shown, the developer though that they did very well with energy, livability and house design, the client thought they did very well with livability and food, and the peers did not think they did really well in any area. It is important to talk about both the similarities and differences in the data and point to any improvements that could be made.
