What is a Gantt Chart?
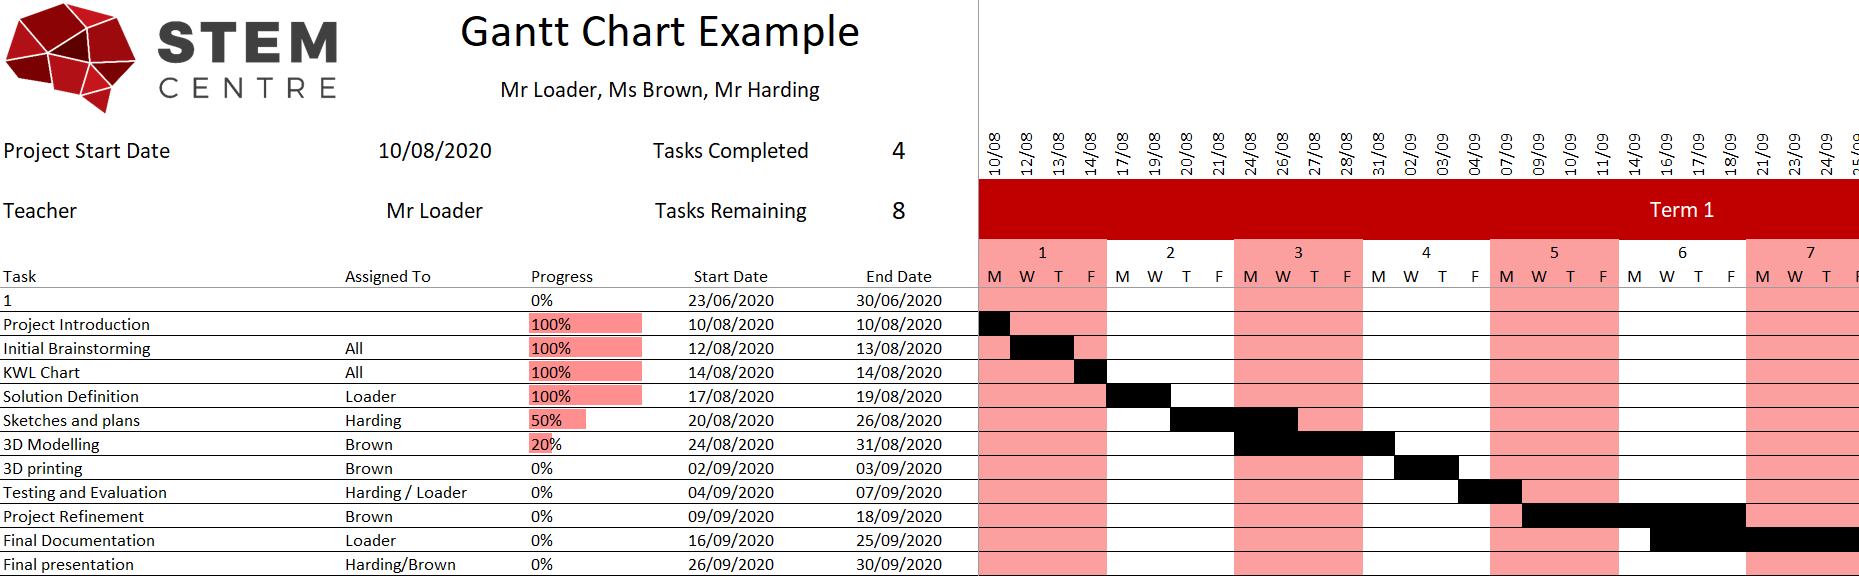
A Gantt chart is a project management tool that allows you to track tasks across time. It allows you to
It is an important tool for time management as it makes it clear in advance how a large task will be achieved in a set time and also what the expectations of each person in the group is. As the entire timeline for the project is determined in advance it also allows you to know quickly when you are getting off track.
Below is a range of templates you can use to generate your Gantt charts. They are organised by the length of your STEM unit, what semester it is in and what day of the week you do not have a lesson. This way you will be able to break your projects into a lesson by lesson timeline.
- Break a large project into a series of smaller tasks
- Determine the length of time each task will take
- Determine which tasks depend on others in the list and which ones can be completed concurrently
- Assign task to particular people in the team
- Track the progress of each task
It is an important tool for time management as it makes it clear in advance how a large task will be achieved in a set time and also what the expectations of each person in the group is. As the entire timeline for the project is determined in advance it also allows you to know quickly when you are getting off track.
Below is a range of templates you can use to generate your Gantt charts. They are organised by the length of your STEM unit, what semester it is in and what day of the week you do not have a lesson. This way you will be able to break your projects into a lesson by lesson timeline.
Semester Length Gantt Chart Templates
Semester 1 Templates
|
|
| ||||||
Semester 2 Templates
|
|
| ||||||
Year Length Gantt Chart Templates
|
|
| ||||||
